Recently I compiled the GitHub latest version on my university’s cluster. This time I didn’t use GUI, what I did is: copy the mesh, xml (generated by GUI on my desktop PC) and src files to the cluster’s corresponding folder, then go into the /DATA/run.cfg file, change the node and CPU numbers, then run “code_Saturne run” command in DATA folder. The case can run, but I have three questions:
On the cluster, I got two nodes, each node has 20 CPUs. In the run.cfg file, I wrote “n_procs: 2 n_threads: 20”. Is this correct? Does “n_threads” mean the total CPUs or the CPUs per node please?
Are there anything else I need to specify in the run.cfg file? For example the Input/output method, MPI rank step, etc. ?
When I want to stop the case and save the results, what command should I run in the terminal? In GUI I can click “Stop now” but in the terminal I don’t know how to stop it.
n_procs is the number of MPI processes used, and n_threads the number of OpenMP threads per CPU.
I do not recommend more than 2 threads per CPU, as OpenMP is not used everywhere, so
(n_procs = 40, n_threads=1) or (n_procs = 20, n_threads=2) are the recommended options.
There have already been similar questions on this forum, regarding performance, so you should find more info by searching.
Regarding stopping the code, I tried but failed. I generated “control_file”, added a line “<time_step_number>1000” into it, and put this file in the DATA folder (I also tried SRC folder). At that moment, the case had run more than 1000 timesteps, so I think the calculation should stop immediately after that timestep. But the calculation didn’t stop, nothing happened. Please could you tell me if anything I did wrong?
Thanks for your reply! I tried but when I put the control_file in RESU/<run_id> folder, the control_file will be deleted immediately, and the calculation can’t stop. Did I write the control_file wrong? I only have one line in the control_file:
Could you please help me with this error? I ran a test case in parallel on cluster, using the setting that you recommended, but still can’t do it.
I have 1 node with 27 CPUs. I set “n_procs: 27, n_threads: 1” in run.cfg, but the calculation can’t start. The error is shown below, the run_solver.log file and two error files are attached.
  ----------------------------------------------------------
 Composing periodicities

 Halo construction with standard neighborhood
 ============================================

 Face interfaces creation
 Definition of periodic vertices
 Vertex interfaces creation
 Halo creation
 Halo definition
    Local halo definition
    Distant halo creation
SIGINT signal (Control+C or equivalent) received.
--> computation interrupted by user.

Call stack:
   1: 0x7fdbf92d9296 <PMPIDI_CH3I_Progress+0x1146>    (libmpi.so.12)
   2: 0x7fdbf93e4c29 <MPIC_Wait+0x39>                 (libmpi.so.12)
   3: 0x7fdbf93e526a <MPIC_Recv+0xea>                 (libmpi.so.12)
   4: 0x7fdbf92bdeef <MPIR_Barrier_intra+0x2ff>       (libmpi.so.12)
   5: 0x7fdbf92bd875 <I_MPIR_Barrier_intra+0x125>     (libmpi.so.12)
   6: 0x7fdbf92bd6cc <MPIR_Barrier+0xc>               (libmpi.so.12)
   7: 0x7fdbf92bd5fc <MPIR_Barrier_impl+0x4c>         (libmpi.so.12)
   8: 0x7fdbf92bf482 <PMPI_Barrier+0x1c2>             (libmpi.so.12)
   9: 0x7fdbfb56bf5f <+0x5f4f5f>                      (libsaturne-7.1.so)
  10: 0x7fdbfb56e229 <cs_mesh_halo_define+0x1139>     (libsaturne-7.1.so)
  11: 0x7fdbfb52e817 <cs_mesh_init_halo+0x1cd7>       (libsaturne-7.1.so)
  12: 0x7fdbfb106aa0 <cs_preprocess_mesh+0x370>       (libsaturne-7.1.so)
  13: 0x7fdbfc156b96 <main+0x2d6>                     (libcs_solver-7.1.so)
  14: 0x7fdbf89e6c05 <__libc_start_main+0xf5>         (libc.so.6)
  15: 0x401879     <>                               (cs_solver)
End of stack
But what strange is: I tried to decrease the process number, using “n_procs: 8, n_threads: 1”, the calculation can run with no error. I also tried to run this case on my desktop PC, it can run with no error. So I think the case setting is ok, the error is related to parallel running.
(I am using the master version from GitHub. When I compiled the code on cluster, I used the semi-automatic installation method. PT-Scotch and ParMETIS were installed with no errors.)
Thank you! I still have no idea what to do with the previous error. But I tried other nodes with different features. Then all the errors disappeared. I think some nodes on my cluster are not compatible with Saturne, or need special settings maybe, for some reason.
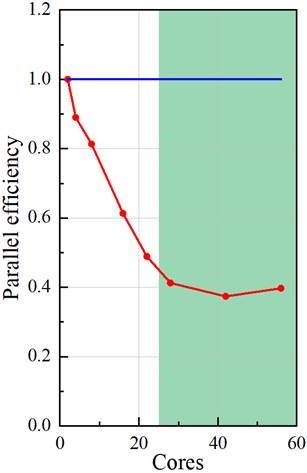
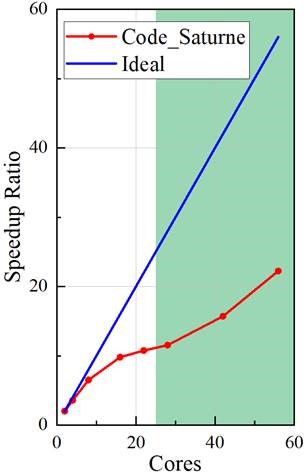
I tested the parallel performance on the cluster, using 2~56 cores. Could you suggest me, based on your experience, whether this parallel performance is good or not?
Please see the two graphs below. The speedup ratio is calculated by (time using 1 core)/(time using n cores). The parallel efficiency is calculated by (speedup ratio)/(core number). I got a parallel efficiency of about 40%. I followed the suggestion: putting 20000~80000 cells per core. This suggested region is highlighted in green.
I can see you are very experienced in parallel optimization, with many papers published. I really appreciate your help.
What type of cluster do you have (processor type, network type, … and even MPI library install)? From one of your older logs I would say Intel(R) Xeon(R) Gold 5120, but that does not tell me whether you have a fast network (Infiniband for example or something with higher latency (Gigabit Ethernet maybe). Or whether the MPI drivers make the best of the network (the compilers and system seem old).
Even on our own clusters (the latest is the one described here https://top500.org/system/179899/), we can observe a factor of 2 on the performance depending on the compilers and especially MPI library configuration used (between optimized libraries and a “generic” workstation-type configuration).
Partitioning quality may play a major role, as well as load balance. Do you have the performance.log files for some of your runs on different number of processes ?
Also, are other codes running on the same nodes, or do you have exclusive access (such as when using SLURM’s --exclusive option, or whatever equivalent option LSF, Torque, or the scheduler/resource manager you use may have ?
And finally, some specific models might not scale as well as the commonly-used ones. The info in timer_stats.csv and performance.log can provide precious feedback, to help see where things are slower.
Thanks a lot for your very useful comments. I have attached the performance.log files when using 2cores, 28cores and 56 cores. I really appreciate it if you could help check.
Here are some details of my cluster:
Processor type: Intel(R) Xeon(R) CPU E5-2660 v4 @ 2.00GHz
Network type: op
MPI version: 3.0 (MPICH 3.1.2)
I have “gold-5120” nodes as well, but these nodes give me errors described in the previous post. So I can only use “e5-2660” nodes now.
Comparison is a bit tricky, since you have 2633 time steps in the 56 cores case, and 1224 in the 28 cores case.
Looking at the averages, I find 0.848 s/time step for the 56 cores case, and 1.64 s/time step for the 28 cores case and 9.34 s/time step for the 2 core case., so efficiency seems to match your curve. I see no specific operation being slower (we have about 2/3 of the time in the linear solvers and gradients for the 2 procs case, and 3/4 for the 56 procs case, so I see no obvious issue here.
If you are on a single node, memory bandwidth saturation does not seem to be the issue either, because in that case you would have very little additional speedup from 28 to 56. So I would guess some MPI or network driver aspect comes into play here. Do you have “vanilla” MPICH 3.1 on the machine, or some version with optimized drivers for OmniPath ? That could be the cause of the performance loss ?
Thanks a lot for your comments! I really appreciate your help!
Sorry for not running the same timesteps for each case. I also use the average time for each step, the same as your method.
Actually not all the cases are on a single node. I have 28 cores per node. So for the 2cores and 28cores cases, I only use one node. But for the 56cores case, I use two nodes. So will the “memory bandwidth saturation” be a problem?
I will check the MPI or network driver thing with my IT support and get back to you soon. Because as you said, if I can increase the parallel performance by a factor of 2, that will be wonderful.